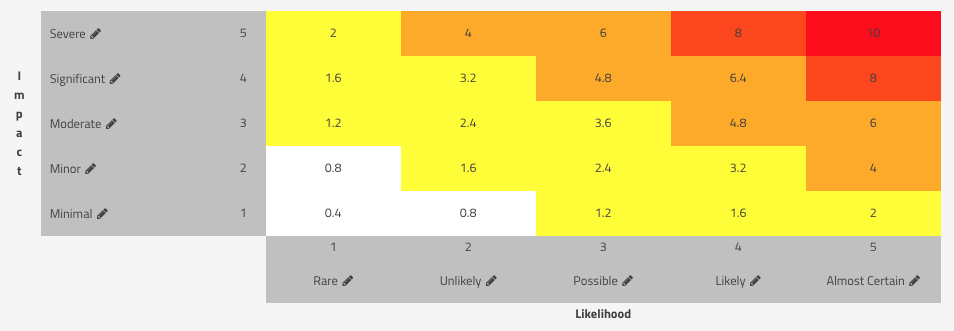
Anyone who has studied for the CISSP exam knows that the "textbook" definition of risk scoring is Risk = Likelihood x Impact. Typically, the Likelihood and Impact values are represented by ordinal numbers, which are mapped to some qualified value. We then use a matrix to represent the intersection of these values in order to obtain a final risk score. Some organizations will use a 3x3 matrix. Some may use a 10x10. Here at SimpleRisk, we've seen just about every combination you could imagine in-between, but the most common scenario is a matrix with five Likelihood values and five Impact values similar to this:

Note that we've used colors to represent qualitative risk values ranging from Insignificant (white) up to Very High (red), but the whole purpose of this risk scoring exercise is so that we can use the result to prioritize action on one risk over another. In other words, a risk with a Severe impact and Likely likelihood is a High level risk (an 8 risk score) and, taking nothing else into consideration, should be prioritized higher than a risk with the same Severe impact and a Possible Likelihood, which would be a Medium level risk (a 6 risk score).
One thing that many people are quick to point out with this matrix in SimpleRisk, however, is that the "math" doesn't make sense. If I have a Severe (5) impact and an Almost Certain (5) likelihood, then my score should be 5x5=25, right? Your math isn't wrong, but keep in mind that our matrix is really just designed to reflect the intersection of a row representing the Impact and a column representing the Likelihood. And the math behind it is just an attempt to figure out that risk prioritization piece. This math problem, however, led me to two major struggles with risk scoring when I was just getting started in risk management.
Struggle #1
In my early days of running the Information Security Program at National Instruments, I experimented a lot. I played around with many different types of risk scoring methodologies, including using weighted likelihood and weighted impact. These methodologies assume that either the likelihood or impact value is more important than the other, and uses a weighted formula to reflect that. In the case of a weighted impact, that might look like:
Risk = Likelihood x Impact + Impact
Now, instead of having a minimum value of 1 and a maximum value of 25 (in the case of my 5x5 matrix above), I've got a minimum of 2 and a maximum of 30. Two months earlier I had told my management that 25 was the highest possible risk score and now I've got risks with a score of 30? Stop the madness! This doesn't make any sense when the whole point of this scoring exercise is to prioritize one risk against all of the others to figure out where to focus our efforts.
Struggle #2
Eventually, I came to the realization that there were other risk scoring methodologies out there that may perform better for different use cases. Let's consider the "BlueKeep" vulnerability (CVE-2019-0708) as an example. Why would I want to use a subjective risk rating methodology, like my example above, when the NIST National Vulnerability Database (NVD) has already given this a more objective risk rating using the CVSS scoring methodology? I'd argue that for pretty much any risk related to an entry in the NVD, using the CVSS score would be the preferable approach. However, we now run into a problem in that the CVSS scoring system uses a 0 through 10 scale, but all of my risks created with the above matrix are on a scale from 1 to 25. How are we supposed to compare these risks against each other? Is a risk with a Significant (4) impact and a Possible (3) likelihood [4x3=12], a Medium risk by most accounts), a higher priority than a different risk with a CVSS score of 10? Probably not.
The Solution
When I first wrote SimpleRisk, I set about to solve both of these issues when creating our "Classic Risk Scoring" methodology. I used some simple math to ensure that every risk, regardless of scoring methodology used, is based on the same 0 through 10 scale:
Risk = Risk Score x 10 / Max Risk Score
For the risk scoring methodologies which already have a maximum score of 10, nothing changes. A 10 in OWASP, is a 10 in DREAD, is a 10 in CVSS. But for Classic risk scoring, as illustrated in our matrix above, a Severe (5) impact and an Almost Certain (5) likelihood, with an overall score of 25, is then calculated as:
Risk = 25 x 10 / 25 = 10
If we use the weighted impact value that I discussed in Struggle #1, it would be calculated as:
Risk = 30 x 10 / 30 = 10
You can experiment with different weightings and the range will always have 0 as the minimum value and 10 as the maximum value. You can try out different scoring methodologies and they will always have this same scoring range. The numbers make sense.
Conclusion
In SimpleRisk, you can customize your scoring matrix by going to the Configure menu and selecting Configure Risk Formula. You can also see the scoring method and formula used to calculate your risk score by opening your risk and expanding the section labeled "Show Risk Scoring Details".
Going back to what I said earlier, risk management is all about prioritization. We want to do our best to ensure that we are comparing apples to apples, and this approach makes that possible.
To learn more about customizing your scoring matrix and discuss use cases, you can schedule a demo online!
Related posts:
The OWASP Risk Rating Methodology and SimpleRisk
How to Assess Your Organization's Cybersecurity Maturity
The Right and Wrong Way to Assess Third Party Risk


