Is precision worth the time? In this blog, we explore how SimpleRisk balances simplicity and effectiveness in risk assessment, offering a quantitative approach without the complexity of methodologies like FAIR, so you can focus more on managing risks than analyzing them.
There is Nothing Simple About FAIR

Currently, SimpleRisk supports six different risk scoring methods. We have Classic Risk, which is the likelihood times impact calculation you probably learned studying for your CISSP. We also support weighted likelihood and impact with that methodology. We support CVSS 2.0, which is the Common Vulnerability Scoring System typically used when calculating the risk score associated with CVE vulnerabilities. We support DREAD, which is the old school Microsoft risk rating methodology. We support the OWASP Risk Rating Methodology, which was designed for assessing application security risks. We support something that we call "Contributing Risk", which came from one of our customers who wanted to be able to specify multiple weighted impacts across a single likelihood. And, finally, we support providing a Custom risk score, which is just a user-defined value between 0 and 10, providing you with the ability to use your own scoring calculations. All of our risk scores are defined on a 0 through 10 scale, which effectively means that you can use them all interchangeably, depending on the subject of the risk.
Being in the business of risk, we frequently get requests from customers and prospects to incorporate various other new risk assessment methodologies into SimpleRisk. They include outliers like Binary Risk Assessment, CIS Risk Assessment Methodology (RAM), and the DoD Risk Management Framework (RMF), but the request we get more than any of these is for the Factored Analysis of Information Risk (FAIR) methodology.
What is FAIR you ask? FAIR is a quantitative model for information security and operational risk. Rather than basing a risk score on a qualitative color chart (Low, Medium, High) or a numerical weighted scale, FAIR tries to quantify information risk in financial terms. If you'd like to learn more about FAIR, the Open Group Technical Standard on the FAIR Risk Taxonomy is available here. That said, the basic breakdown of an example application on page 24 of that document reads as follows:
- Stage 1: Identify scenario components:
- Identify the asset at risk
- Identify the threat community under consideration
- Stage 2: Evaluate Loss Event Frequency (LEF):
- Estimate the probable Threat Event Frequency (TEF)
- Estimate the Threat Capability (TCap)
- Estimate Control Strength (CS)
- Derive Vulnerability (Vuln)
- Derive Loss Event Frequency (LEF)
- Stage 3: Evaluate Probable Loss Magnitude (PLM):
- Estimate worst-case loss
- Estimate Probable Loss Magnitude (PLM)
- Stage 4: Derive and articulate risk:
- Derive and articulate risk
If you think that sounds complicated, believe me, you are not alone. Now, imagine having to perform this activity for every risk, on at least an annual basis. I'm sure that you can imagine how much time is involved here, which leads me to the point of this blog post.
FAIR was never designed for simplicity; it was designed for precision. SimpleRisk, on the other hand, was designed from the beginning to be an intuitive and efficient risk management solution. Our customers choose SimpleRisk because they recognize the value in managing risk, but realize that there is also an opportunity cost associated with spending too much time managing it. Not to mention that users have been known to circumvent risk management processes entirely when they become too cumbersome. Hopefully this helps to illustrate why FAIR and SimpleRisk really wouldn't work well together. That said, just because we don't use FAIR, doesn't mean that SimpleRisk can't handle quantitative risk.
When we dig into what a FAIR risk assessment is doing, they assess risk based on a combination of Loss Event Frequency (LEF) and Probable Loss Magnitude (PLM). The LEF uses parameters such as Threat Event Frequency and Vulnerability and is really just another way to estimate the Likelihood of an event. The PLM estimates primary and secondary loss factors in order to estimate the Impact of an event. There is no reason why this estimation couldn't be performed with a different risk assessment methodology, and in fact, I would argue that CVSS scoring could provide you with you a similar level of assessment. The main place where FAIR and CVSS differ is in how they estimate what FAIR calls the Asset Loss Factor. In FAIR, you determine an asset's value based on its Criticality, Cost, and Sensitivity and factor in the Volume of that asset. This allows you to get to a quantitative value for the risk. In CVSS, you are simply determining the impact based on how the risk affects the Confidentiality, Integrity, and Availability of the asset. This leaves you with a qualitative impact score.
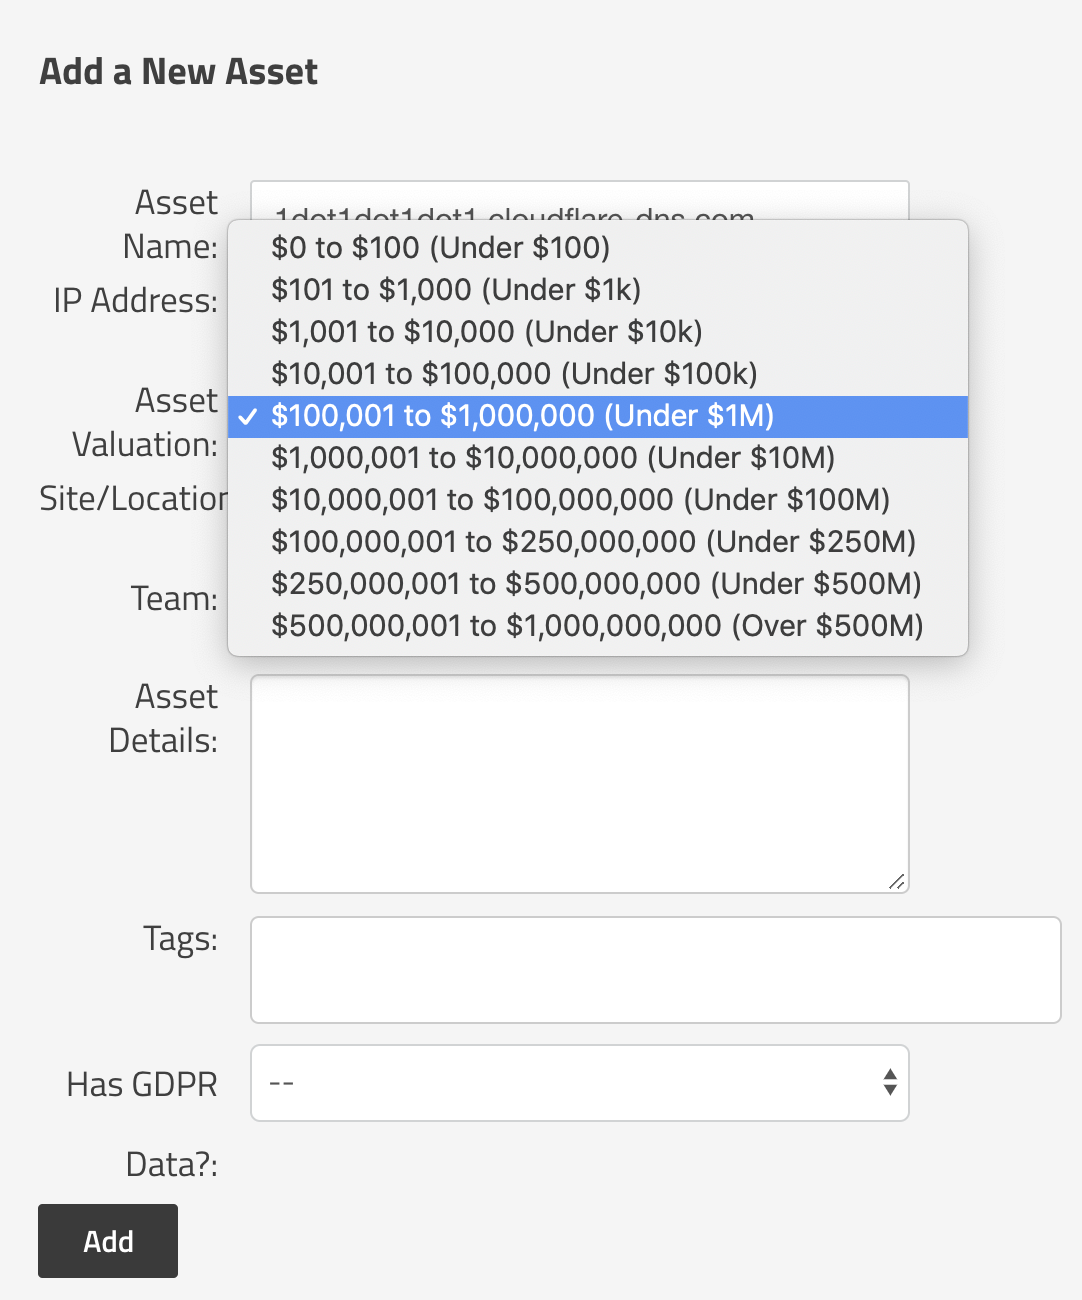
The way that we move from a qualitative score to a quantitative score in SimpleRisk is similar to how FAIR does it. We look at the value of the assets. With FAIR, it can sometimes be difficult and time consuming to assess the Criticality, Sensitivity, and Cost in order to determine an asset's value. In SimpleRisk, we've simplified this to just be a selection of a range of asset values such as $0-100, $100-$1k, $1k-$10k, etc.
These ranges are completely configurable for your organization.
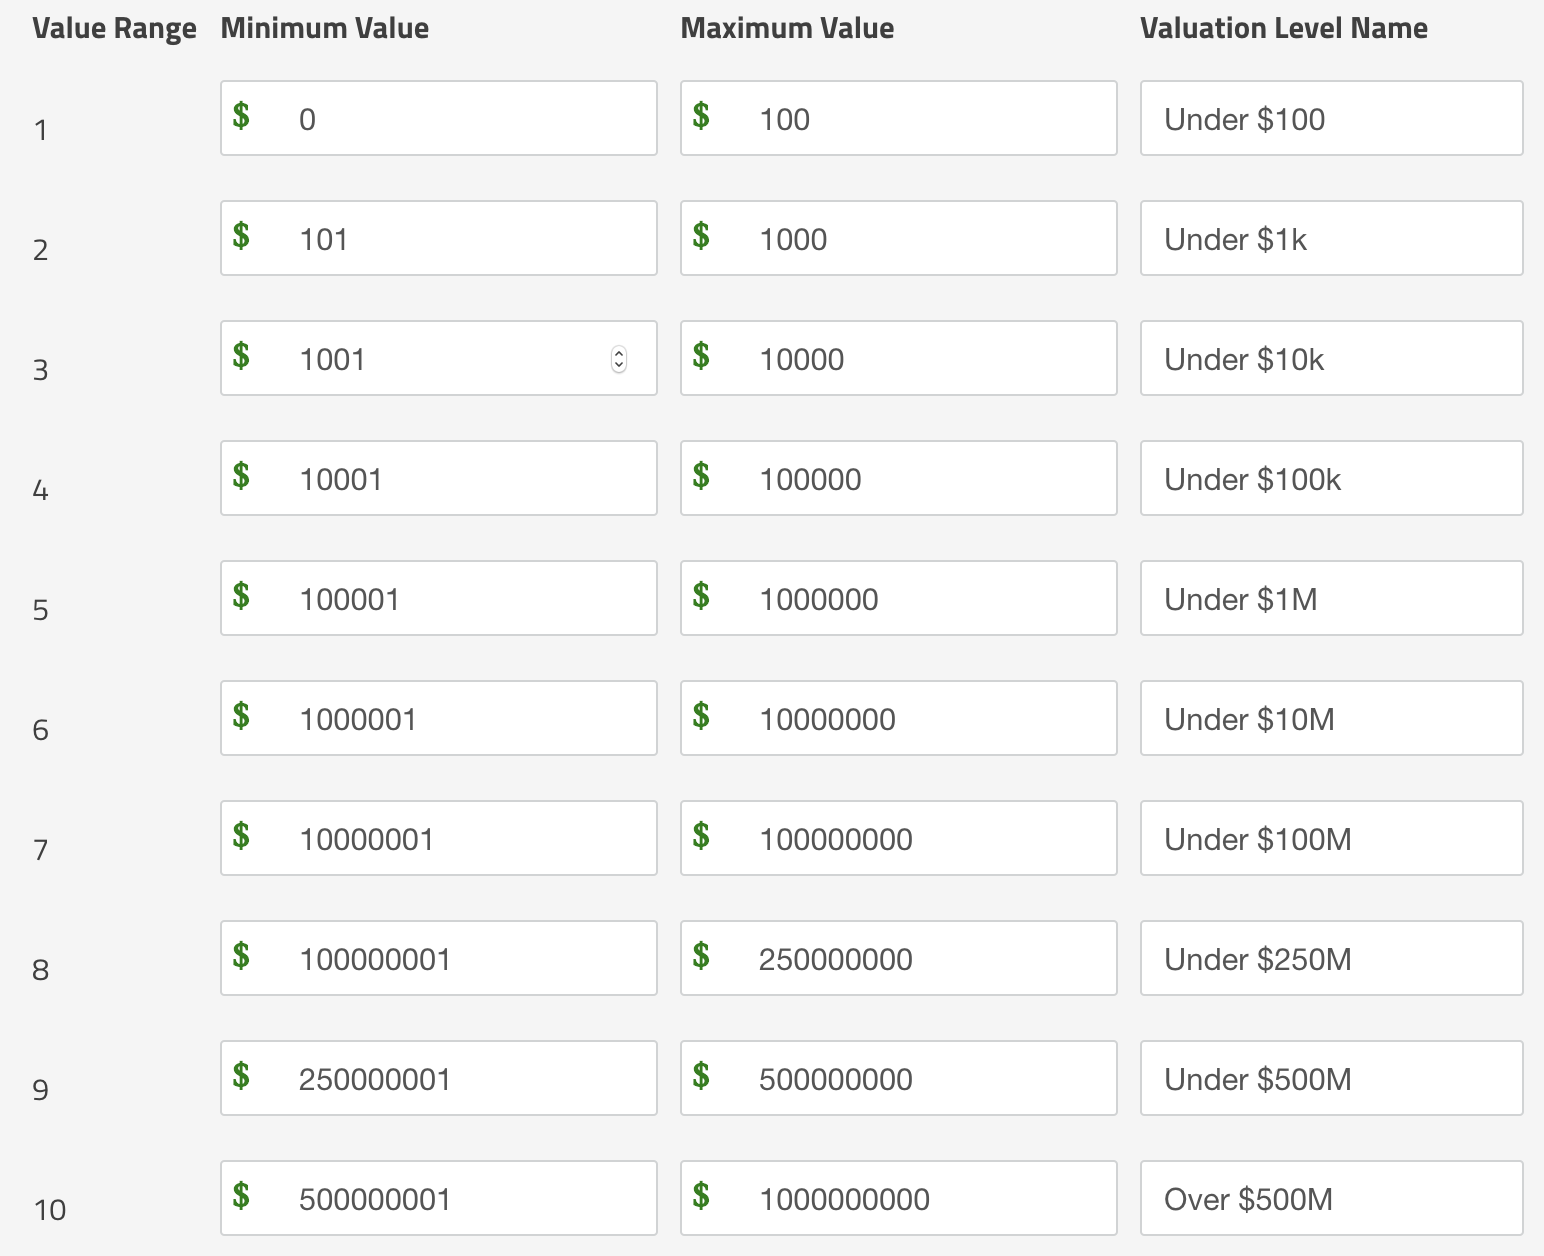
The result is a scale that even a novice risk practitioner can use to determine their asset's value.
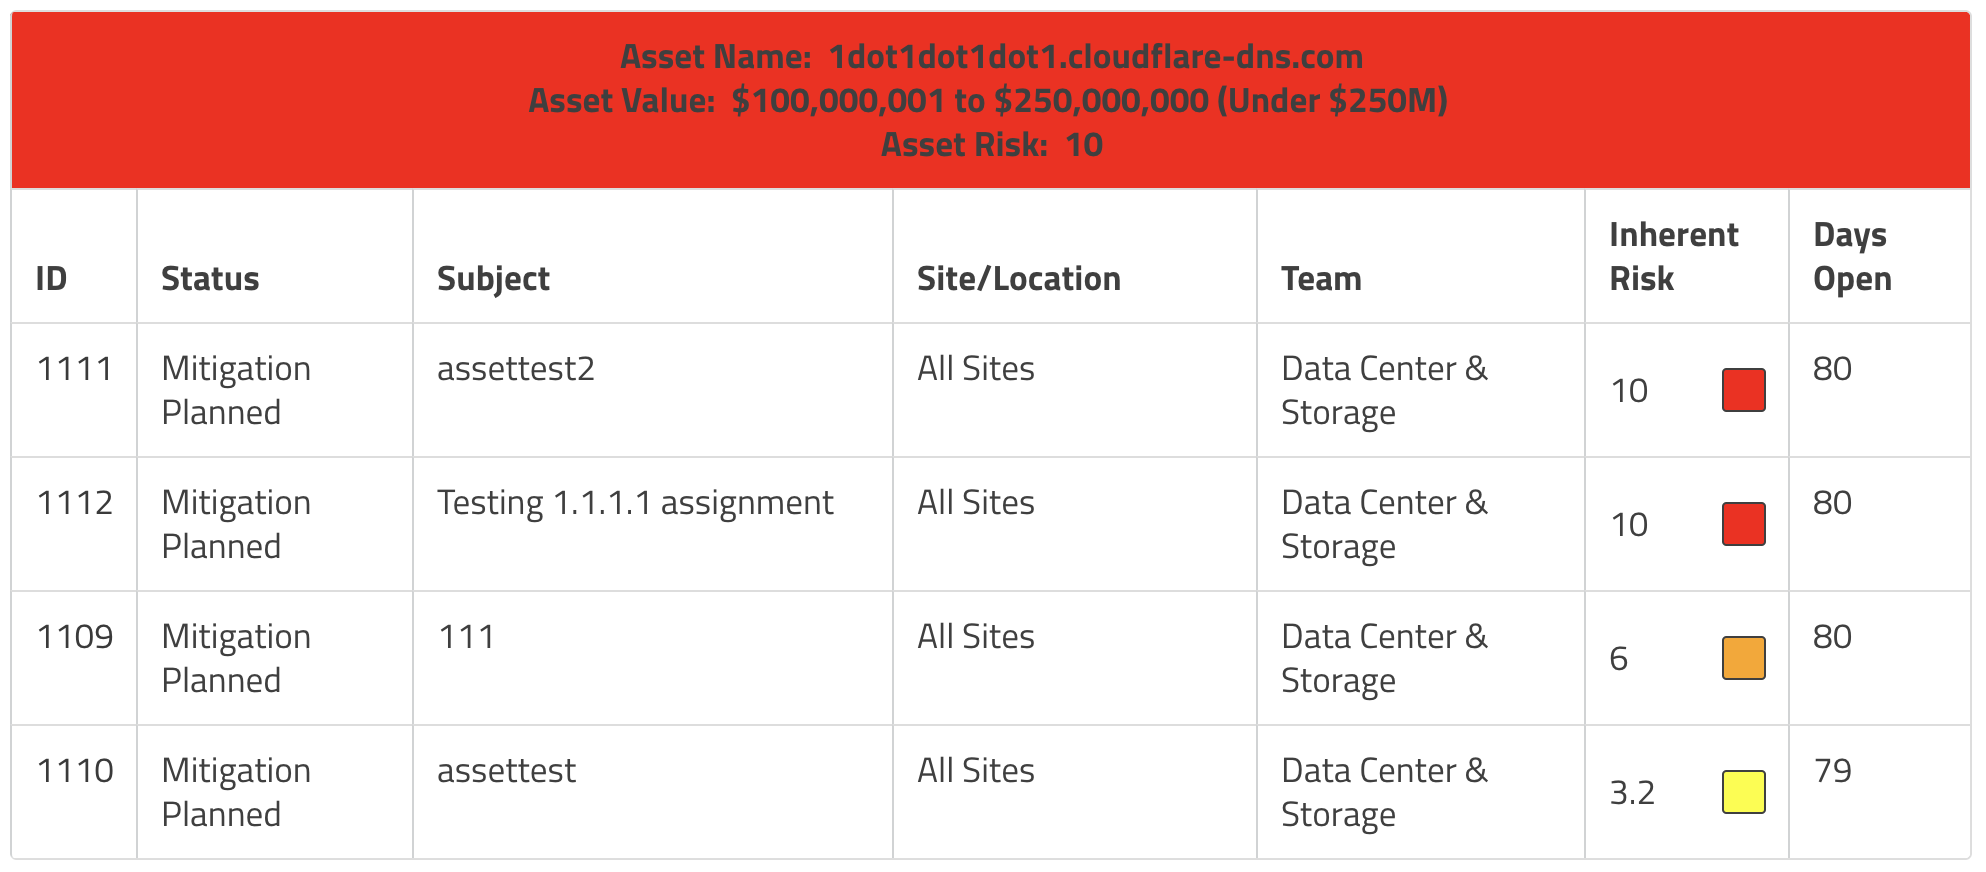
Once we've estimated a risk score, associated assets with the risk, and provided a value for those assets, we can now use the Risks and Assets report in SimpleRisk. The default view of this report shows Risks by Asset. This view will order assets by their valuation and the header bar will show the color of the highest risk score for that asset. This report is an excellent way to identify high value assets with a significant amount of risk because they will be at the top of the page and red in color. Target those risks for mitigation, close out the risks, and the color for that asset will change as you reduce the risk for these high-value assets.
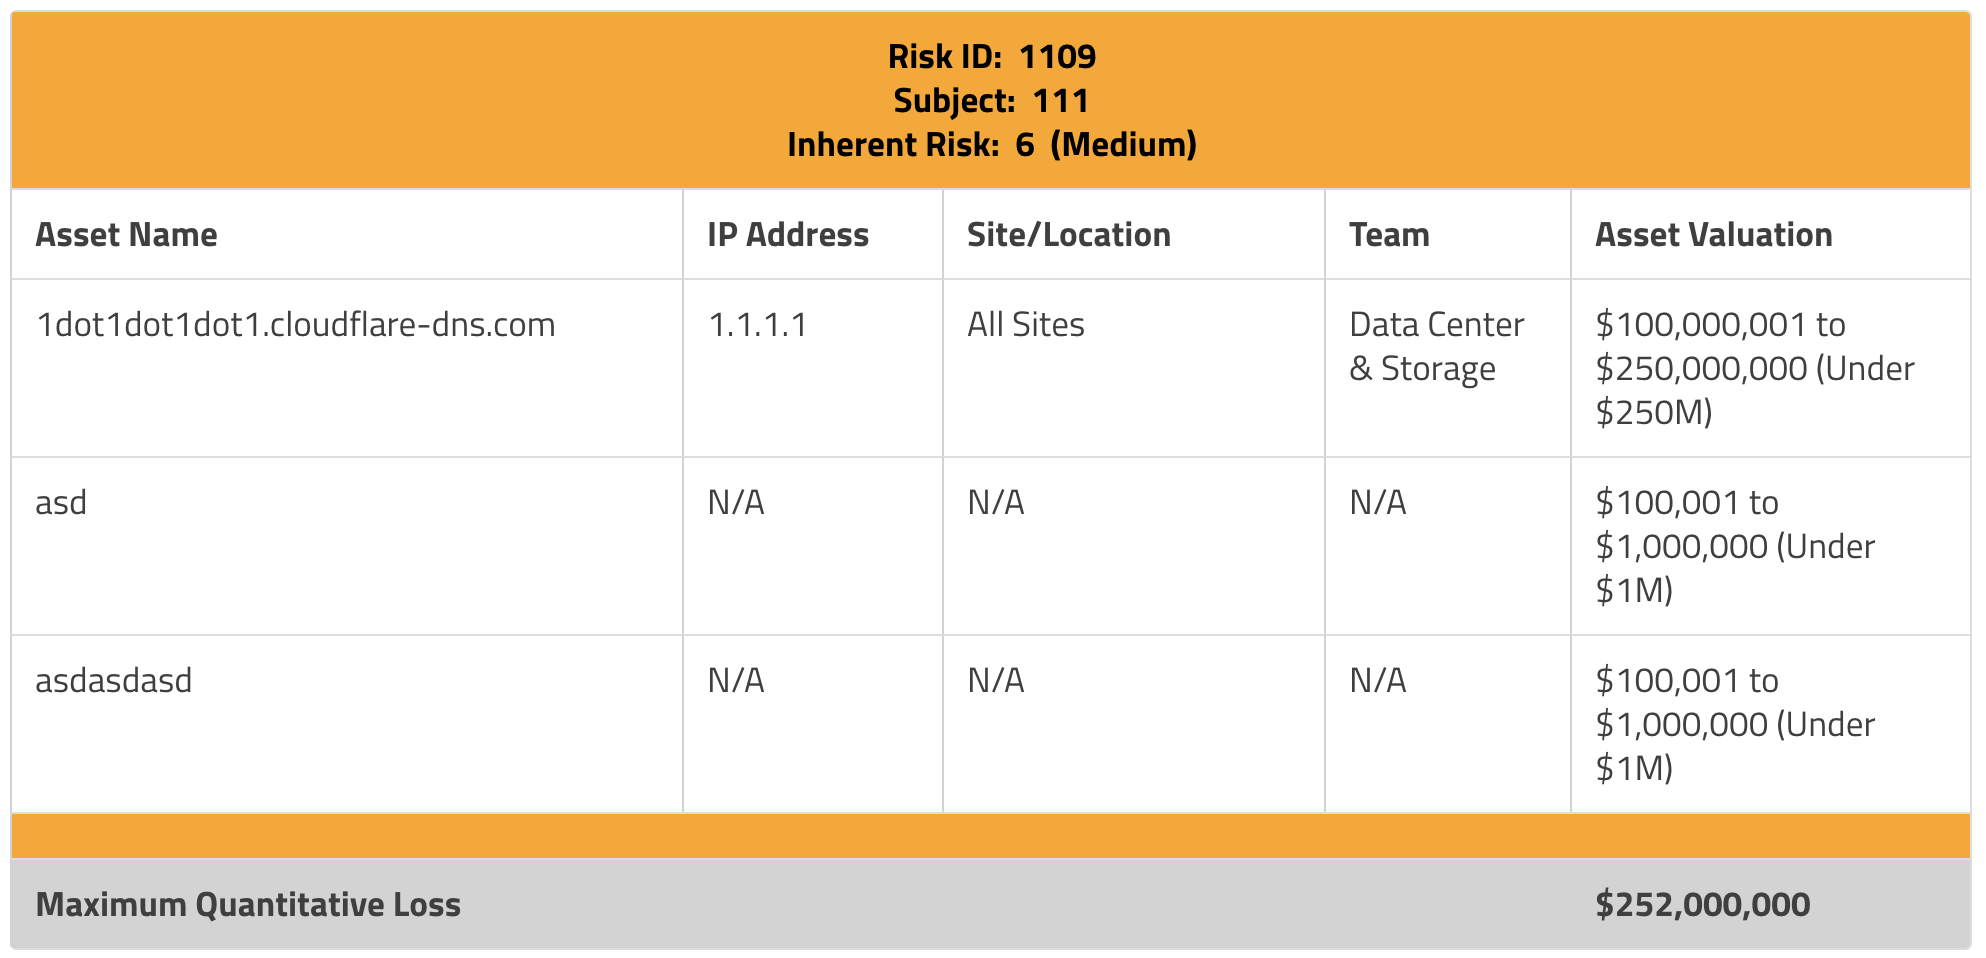
That's super helpful, but doesn't yet move us to quantitative assessment. The way we do this in SimpleRisk is by changing the report selector at the top from Risks by Asset to Assets by Risk. This gives us a new view where we can see all risks, ordered by risk score, with a list of affected assets underneath. We then take the maximum value of each of those assets, add them together, and something really interesting happens. We now get the cumulative value of all of the assets and present that to you as what we call the Maximum Quantitative Loss. Another way to say that is the most you could expect to lose if the worst case scenario happens across all of those assets.
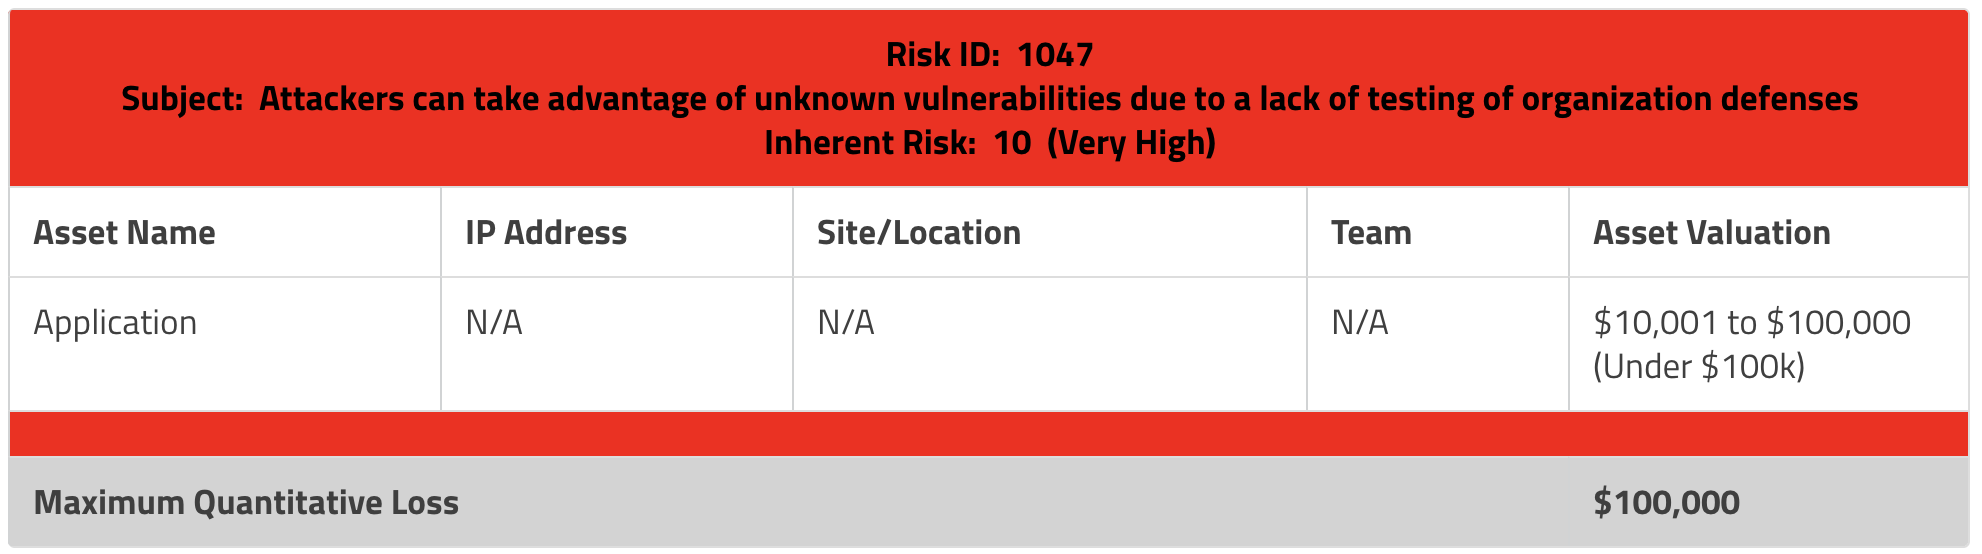
With the Maximum Quantitative Loss value, we can now look at our risks in a quantitative fashion, similar to FAIR. In the above example, the risk is a 10 (Very High). It doesn't get much worse than that, does it? But when we look at the maximum quantitative loss for this risk, it's relatively tiny. Only $100k. Compare that to the example below where we have three far larger assets that could be impacted for a total maximum quantitative loss of $252M!
This brings us back to the original premise of my post. You absolutely could use FAIR to create a more precise quantitative assessment for these risks. You would spend a significant amount of time and effort and come away with a list of all of the risks and what should be a fairly accurate estimation of the cost impact of the risk. But there is a huge opportunity cost of spending all of that time and effort on assessing risk rather than managing it. It is typically an activity that requires an expert to perform and that doesn't scale well. Using a tool like SimpleRisk, however, we are able to get a decent approximation of the quantitative value of our risks while spending a fraction of the time in doing so. In most cases we have found that our customers value simplicity over precision and that this approach has proven to be good enough.
All of the features that I've discussed here are available in the open source version of SimpleRisk. You can download it yourself or sign up for a free 30 day trial today!
Want to learn more? Check out these related posts:

Risk Management for Dummies
Explaining risk management to someone new to the concept can be a challenge, but it’s a skill we use daily without realizing it. Learn how a conversation about home security turned into a practical analogy for understanding risks and how SimpleRisk helps prioritize and address them.

How to Perform Risk Assessments (with SimpleRisk)
Curious about how SimpleRisk simplifies internal and third-party risk assessments? Check out this quick 1-minute animated video showcasing our key capabilities in action!

Should Vulnerabilities and Risks be Managed in the Same Place?
Should vulnerabilities be managed as risks? While both are essential to cybersecurity, understanding their differences and how they complement each other is key to deciding whether to track them together in a single risk management system.